Table of Contents
1 Libvis basic usage
1.1 Start the server
1.2 Visualisation of different objects
-Number” data-toc-modified-id=”Number–>-Number-1.2.1”>1.2.1 Number -> Number
-Line-graph” data-toc-modified-id=”List-of-numbers–>-Line-graph-1.2.2”>1.2.2 List of numbers -> Line graph
-Image” data-toc-modified-id=”2d-Array–>-Image-1.2.3”>1.2.3 2d Array -> Image
1.3 Restart the server
1.4 Live data stream
1.5 Matplotlib figures
1.6 Bokeh figures
1.7 Seaborn: large dataset
1.8 Camera live stream
[1]:
import numpy as np
import matplotlib.pyplot as plt
from tqdm.auto import tqdm
import time

from libvis import Vis
import libvis.modules

%load_ext autoreload
%autoreload 2
Libvis basic usage
Start the server
[2]:
vis = Vis(ws_port=7700, vis_port=7000, allow_remote=True)
Started libvis app at http://0.0.0.0:7000
Visualisation of different objects
Number -> Number
[3]:
vis.vars.number = 1
List of numbers -> Line graph
The idea behind libvis is that any object has a visual representation. The default representation for a list is a line graph.
The 1-d numpy array also will be represented as a line graph
[4]:
vis.vars.graph = [2, 1, 7, 1, 8, 2, 8]

x = np.linspace(0, 10, 50)
vis.vars.graph_numpy = np.sin(x)
2d Array -> Image
[5]:
im = np.random.randn(201,120,3)*145
vis.vars.image_canvas = im
[6]:
from libvis.modules import Image
[7]:
im = np.random.randn(120,201,3)*.5
vis.vars.image_png = Image(im)
Restart the server
[8]:
vis.stop()
Stopping webapp http server: `Vis.stop_http()`... OK
Stopping websocket server: `Vis.app.stop()`... OK
[9]:
vis.start()
Started libvis app at http://0.0.0.0:7000
Live data stream
[10]:
vis.vars.stream = [1]
for i in range(100):
    vis.vars.stream += [np.random.randint(100)]
    time.sleep(.005)
Lissajous curves
[11]:
for i in tqdm(range(100)):
    vis.vars.test=np.sin(
        [
         np.linspace(0 +i/10,10+i/10, 40)
        ,np.linspace(10+i/5, 10+i/10, 40)
        ,np.linspace(10+i/5, 5 +i/10, 40)
        ]
    ).tolist()
    time.sleep(0.1)
127.0.0.1 - - [08/Oct/2020 14:51:58] "GET / HTTP/1.1" 200 -
127.0.0.1 - - [08/Oct/2020 14:51:58] "GET /index.bundle.js?94bf264022802c3c715f HTTP/1.1" 200 -
127.0.0.1 - - [08/Oct/2020 14:51:59] "GET /favicon.ico HTTP/1.1" 200 -
This should plot following in webapp:

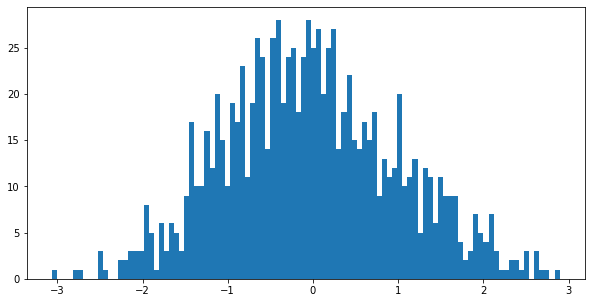
Matplotlib figures
[91]:
N = np.random.randn(1000)
fig, ax = plt.subplots(figsize=(10,5))
ax.hist(N,bins=100)
vis.vars.image = fig
Bokeh figures
Bokeh is a better plotting utility that allows scalable interactive plots
[12]:
from bokeh.plotting import figure
from bokeh.transform import linear_cmap
from bokeh.util.hex import hexbin
from bokeh.embed import file_html
import bokeh

n = 50000
x = np.random.standard_normal(n)
y = np.random.standard_normal(n)

bins = hexbin(x, y, 0.1)

p = figure(title="Manual hex bin for 50000 points", tools="wheel_zoom,pan,reset",
           match_aspect=True,
           sizing_mode='stretch_both',
           plot_width=300, plot_height=300,
           background_fill_color='#440154')
p.grid.visible = False

p.hex_tile(q="q", r="r", size=0.1, line_color=None, source=bins,
           fill_color=linear_cmap('counts', 'Viridis256', 0, max(bins.counts)))
type(p)

vis.vars.bokeh = p
Resulting interactive widget:

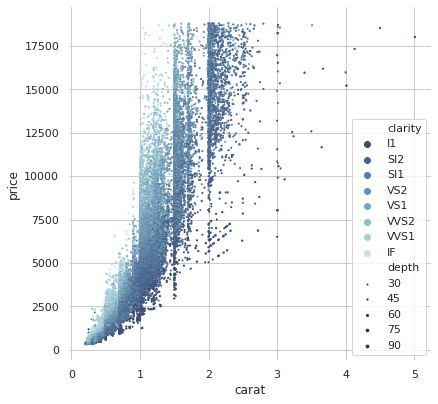
Seaborn: large dataset
Seaborn is advanced statistical plotting utility based on matplitlib.
The following picture has a 54K datapoints, and it starts to be laggy.
[97]:
import seaborn as sns
import matplotlib.pyplot as plt
sns.set(style="whitegrid")

# Load the example iris dataset
diamonds = sns.load_dataset("diamonds")
diamonds
[97]:
| carat | cut | color | clarity | depth | table | price | x | y | z | |
|---|---|---|---|---|---|---|---|---|---|---|
| 0 | 0.23 | Ideal | E | SI2 | 61.5 | 55.0 | 326 | 3.95 | 3.98 | 2.43 |
| 1 | 0.21 | Premium | E | SI1 | 59.8 | 61.0 | 326 | 3.89 | 3.84 | 2.31 |
| 2 | 0.23 | Good | E | VS1 | 56.9 | 65.0 | 327 | 4.05 | 4.07 | 2.31 |
| 3 | 0.29 | Premium | I | VS2 | 62.4 | 58.0 | 334 | 4.20 | 4.23 | 2.63 |
| 4 | 0.31 | Good | J | SI2 | 63.3 | 58.0 | 335 | 4.34 | 4.35 | 2.75 |
| ... | ... | ... | ... | ... | ... | ... | ... | ... | ... | ... |
| 53935 | 0.72 | Ideal | D | SI1 | 60.8 | 57.0 | 2757 | 5.75 | 5.76 | 3.50 |
| 53936 | 0.72 | Good | D | SI1 | 63.1 | 55.0 | 2757 | 5.69 | 5.75 | 3.61 |
| 53937 | 0.70 | Very Good | D | SI1 | 62.8 | 60.0 | 2757 | 5.66 | 5.68 | 3.56 |
| 53938 | 0.86 | Premium | H | SI2 | 61.0 | 58.0 | 2757 | 6.15 | 6.12 | 3.74 |
| 53939 | 0.75 | Ideal | D | SI2 | 62.2 | 55.0 | 2757 | 5.83 | 5.87 | 3.64 |
53940 rows × 10 columns
[95]:
# Draw a scatter plot while assigning point colors and sizes to different
# variables in the dataset
f, ax = plt.subplots(figsize=(6.5, 6.5))
sns.despine(f, left=True, bottom=True)
clarity_ranking = ["I1", "SI2", "SI1", "VS2", "VS1", "VVS2", "VVS1", "IF"]
sns.scatterplot(x="carat", y="price",
                hue="clarity", size="depth",
                palette="ch:r=-.2,d=.3_r",
                hue_order=clarity_ranking,
                sizes=(1, 8), linewidth=0,
                data=diamonds, ax=ax)

vis.vars.sns = f
/usr/lib/python3.8/site-packages/mpld3-0.3-py3.8.egg/mpld3/mplexporter/exporter.py:267: MatplotlibDeprecationWarning:
The get_offset_position function was deprecated in Matplotlib 3.3 and will be removed two minor releases later.
  offset_order = offset_dict[collection.get_offset_position()]
192.168.0.8 - - [08/Oct/2020 05:40:32] "GET / HTTP/1.1" 200 -
192.168.0.8 - - [08/Oct/2020 05:40:33] "GET /index.bundle.js?94bf264022802c3c715f HTTP/1.1" 200 -
192.168.0.8 - - [08/Oct/2020 05:40:34] "GET /favicon.ico HTTP/1.1" 200 -
Camera live stream
[98]:
import cv2
[107]:
cap = cv2.VideoCapture(0)
camera_opened = cap.isOpened()
print('Camera opened:', camera_opened)

if camera_opened:
    ret, frame = cap.read()
    if ret:
        print('Camera frame shape:', frame.shape)
Camera opened: True
Camera frame shape: (720, 1280, 3)
[108]:
for i in range(10):

    ret, frame = cap.read()
    if ret:
        vis.vars.image = frame[:320, :480, :]

    time.sleep(0.9)
127.0.0.1 - - [08/Oct/2020 05:47:01] "GET / HTTP/1.1" 200 -
127.0.0.1 - - [08/Oct/2020 05:47:01] "GET /index.bundle.js?94bf264022802c3c715f HTTP/1.1" 200 -
127.0.0.1 - - [08/Oct/2020 05:47:01] "GET /favicon.ico HTTP/1.1" 200 -
127.0.0.1 - - [08/Oct/2020 05:47:17] "GET / HTTP/1.1" 200 -
127.0.0.1 - - [08/Oct/2020 05:47:18] "GET /index.bundle.js?94bf264022802c3c715f HTTP/1.1" 200 -
127.0.0.1 - - [08/Oct/2020 05:47:20] "GET /favicon.ico HTTP/1.1" 200 -
[13]:
# close the camera
cap.release()
[ ]:
# Stop the server
vis.stop()
Stopping webapp http server: `Vis.stop_http()`...