Quick start
First steps
Fire up your python interpreter or jupyter notebook
and type the following:
from libvis import Vis
vis = Vis()
vis.start()
vis.vars.test = [ x**2 for x in range(-20,20) ]
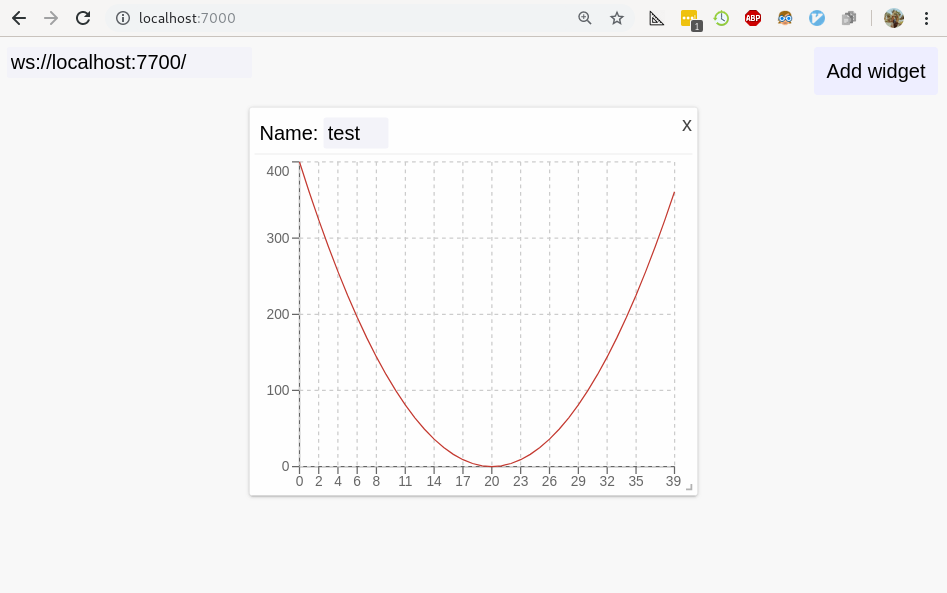
Now, open localhost:7000 in your browser.
There’s not much there now, but let’s go ahead and click ‘Add Widget’ button at the top left.
Widgets are basic blocks of our dashboard, you can drag them and resize.
Type in the name of your variable, test, and your array will appear.
Interactive
Now, the most awesome feature about libvis is that
python objects from vis.vars are automatically synchronized.
Try this one:
v.vars.test += [20**2]*5
Any time you assign to an attribute of Vis.vars, stores it in a
special place, and another thread that listens to updates sends data
to the app via websocket.